Someone asks: "What's driving sales this quarter?"
You know the answer is buried in the data. But showing it is harder than it sounds. Letting someone click through Region → Category → Sub-Category and watch the numbers break apart? That's a different problem.
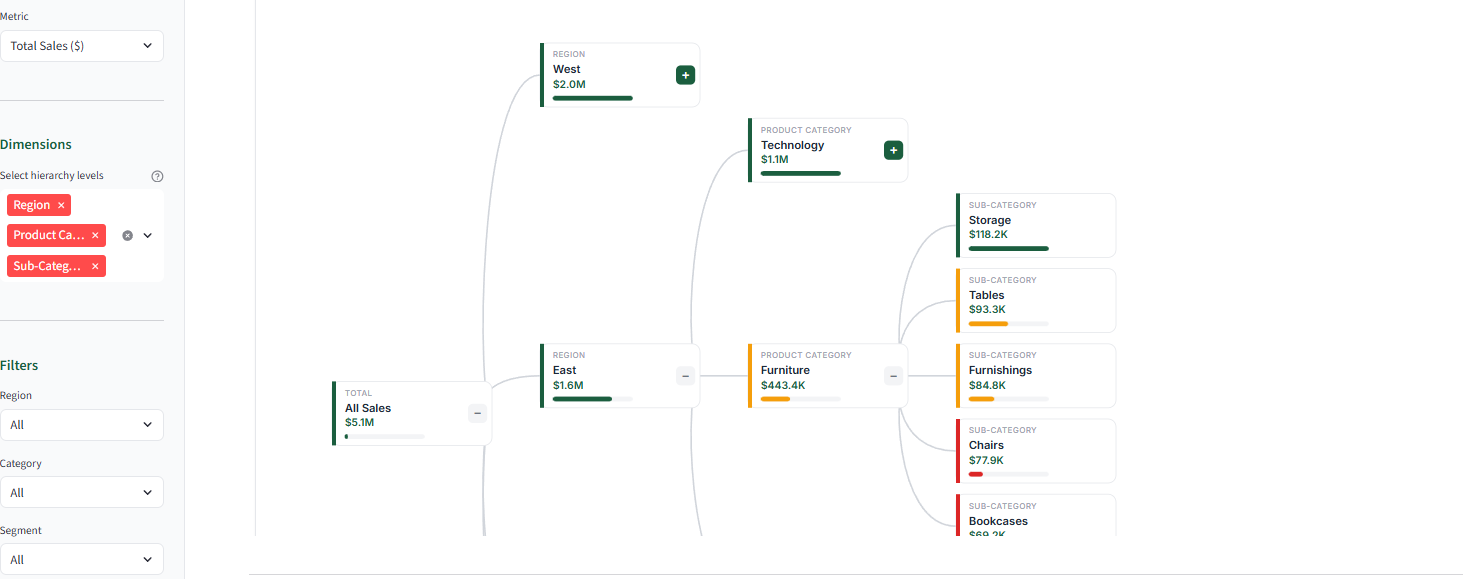
Power BI has this chart. It's called a decomposition tree. You start with a big number at the top, click to break it into pieces, click again to break those pieces into smaller pieces. Like opening nested boxes until you find what you're looking for.
I needed one in Streamlit in Snowflake. It didn't exist. So I built it.
Why This Chart Matters
Every stakeholder asks the same question: "What's driving this number?"
In a traditional dashboard, answering that takes work. Click a filter. Wait for it to load. Click another filter. Switch to a different view. Wait again. Drill into a chart. Lose your place. Start over. By the time you find the answer, the meeting has moved on.
A decomposition tree puts drivers one click away.
Imagine you run a store. Total sales are $2.3 million. Good or bad? You don't know until you open the box.
Click: West region is $800K, East is $600K, Central is $500K, South is $400K.
Click again: In the West, Technology is $400K, Furniture is $250K, Office Supplies is $150K.
Click again: In Technology, Phones are $200K, Computers are $120K, Accessories are $80K.
Three clicks. Three seconds. Now you see it. Phones in the West region are carrying your business.
No filter panel. No page navigation. No waiting for queries to run. The hierarchy is already there. You just open the boxes.
The Problem: Snowflake's Walled Garden
Streamlit in Snowflake blocks external code. When your app loads, Snowflake says: "You can only run code that's already here. No downloading JavaScript libraries from the internet."
This is called a Content Security Policy (CSP). It's a security feature. But it means D3.js and other charting libraries won't load. The script tag gets blocked. Your visualization breaks.
The Solution: Build It By Hand
If you can't import a library, you write the code yourself. Vanilla JavaScript. Inline SVG. Everything lives inside one HTML string that you pass to Streamlit.
Snowflake blocks external code, not your code. If you write the JavaScript directly in your app, it runs fine.
Here's how it works:
Step 1: Turn flat data into a tree. The build_hierarchy function (line 164) uses data.groupby(current_dim) to nest your data. Region contains Categories. Categories contain Sub-Categories. Boxes inside boxes.
Step 2: Draw without D3. The createElementNS calls (starting line 338) create SVG elements by hand. Five lines to draw one rectangle instead of one. But these five lines work inside Snowflake. D3 doesn't.
Step 3: Make it interactive. The click handler (line 387) flips node.expanded from false to true, then redraws. No framework. Just a boolean and a redraw.
Step 4: Send it to Streamlit. The components.html() call (line bindsmain app) renders everything. Snowflake's CSP sees nothing external, so it allows it.
Get the Code
Full source on GitHub: github.com/grosz99/decomp_tree_syllabi
Clone it. Swap in your data. Deploy to Streamlit in Snowflake.
The dimensions are configurable in DATA_CONFIG (line 67). Change the list to match your business. Region → Category → Sub-Category becomes Division → Department → Team. The tree adapts.
The Takeaway
The constraint that felt limiting (no external dependencies) forces cleaner architecture. No version conflicts. No CDN outages. No "works locally, breaks in production."
When the platform says no, sometimes the answer is to build it yourself.
Credit to Claude Code for helping me work through the vanilla JavaScript approach. Pair programming with AI made the SVG rendering and interaction logic much faster to figure out than going solo.
Working on something similar? Reply. I want to hear about it.